The Great British Energy Leak: Where the UK Needs the Warm Homes Scheme the Most
Published: June 24, 2026
Published: June 24, 2026
The tide is turning on Britain’s energy struggles. With the rollout of the Warm Homes Plan, the government has launched its flagship response to the affordability crisis that has gripped the nation for years.
Here at SuperFOIL, we set out to uncover where the help is needed most by conducting a deep dive into the UK’s housing landscape to identify the areas with the ‘leakiest homes’ – the properties where energy (and money) literally escapes through the walls.
To understand which areas are vulnerable to energy loss and are subsequently in need of support, we analysed 290 local authorities across the UK, comparing EPC (Energy Performance Certificate) data, emissions levels, fuel poverty, dwelling stock and the area’s population.
The locations in the top 50, which were found to have the ‘leakiest’ homes, have been categorised into a red zone, where properties most urgently need energy upgrades and support from schemes such as Warm Homes.
The 20 areas which just missed out on being placed in the red zone have been highlighted as amber risk locations. If improvements aren’t made in these areas over the next couple of years, they’re likely to slip into the highest-risk category.
In contrast, the local authorities, which were found to rank most favourably, made it to the green zone, marking them as some of the most energy-efficient places to call home.
Each category was fairly weighted to give every location a total energy ‘leakiness’ score out of 100, which was then ranked.
The leakiest homes in the UK belong to those in North Northamptonshire, making the local authority one of the areas most likely to benefit from energy-efficiency measures.
According to the authority’s gas emissions estimates, both electricity and gas emissions ranked among the highest in the top 50, while 10.3% of households were recorded as living in fuel poverty.
But the story doesn’t end at the Northern border of the county, as our analysis found that West Northamptonshire followed closely behind in the top three for leaky homes.
This suggests a significant ‘heat-loss hotspot’ right in the heart of England, highlighting where action is needed to change the scope of homes struggling with energy efficiency loss.
Interestingly, West Northamptonshire announced this year that the area has been allocated £2.6m of funding over three years through the Warm Homes scheme, with the intention to tackle residential energy costs, lift thousands out of fuel poverty and reduce carbon emissions.
Buckinghamshire ranks as the third ‘leakiest’ area, while homes with an EPC rating below C were relatively lower compared to the rest of the list; its high gas emissions estimates suggest that residents here are likely to be among the most receptive to the positive impact of this new scheme.
Out of all 50 areas in the red zone, it was revealed that Staffordshire and Surrey are the most problematic areas, with the highest number of local authorities in the top 50, with seven areas in each having the leakiest homes.

The West Midlands closely followed behind with six local authorities, with Worcestershire, West Yorkshire, Lincolnshire and South Yorkshire, tying for the third, having three local authorities each in the red zone.
This high concentration of particular counties suggests that there is a need for more targeted, county-wide energy efficiency schemes across the UK.
While there is a local grant scheme, it is currently household-specific and application-based. Our data reveals that to achieve a truly successful rollout, these grants must be made more widely accessible to address the regional clusters of energy waste we’ve identified.
Twenty local authorities just managed to keep their heads above water but were still classified as amber areas – those at risk of slipping into the poorest energy-efficiency category – as the areas most in need of warm homes continue to be addressed.
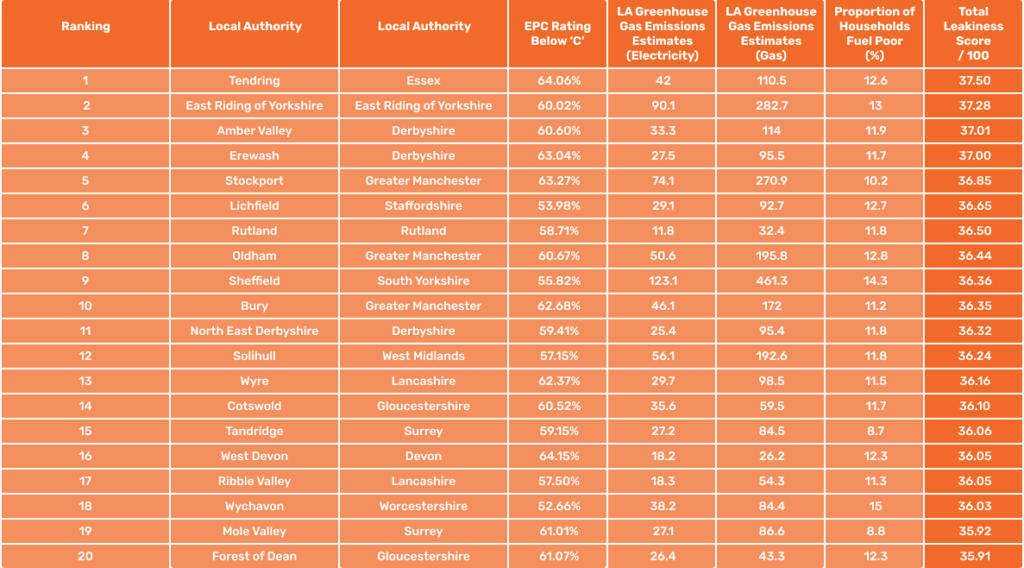
Tendring in Essex was found to be at the top of the amber zone, with 64.06% of homes having an EPC rating below ‘C’, and the area as a whole having a significantly high domestic gas emissions estimate of 282.7.
Stretching across the map to the North, East Riding of Yorkshire ranked as the second most at-risk local authority, largely due to having 60.02% of homes under the EPC ‘C’ rating, as well as having the highest proportion of households in the amber zone classed as fuel poor, at 13%.
Meanwhile, Amber Valley in Derby ranked as the third most at-risk area, with 60.60% of homes listed as having an EPC rating below ‘C’, along with a notably high gas emissions estimate of 114.
From a county-wide perspective, both Greater Manchester and Derbyshire are the most at-risk counties, with three local authorities falling in the amber zone. Moreover, Lancashire, Staffordshire, Surrey, and Gloucestershire followed suit with two local authorities each in the most at-risk category.
If action isn’t taken, these areas could quickly slip into the red zone, with households facing higher energy costs and worsening efficiency standards. Targeted upgrades and support schemes like Warm Homes will be key to preventing these amber locations from becoming the next hotspots of energy inefficiency.
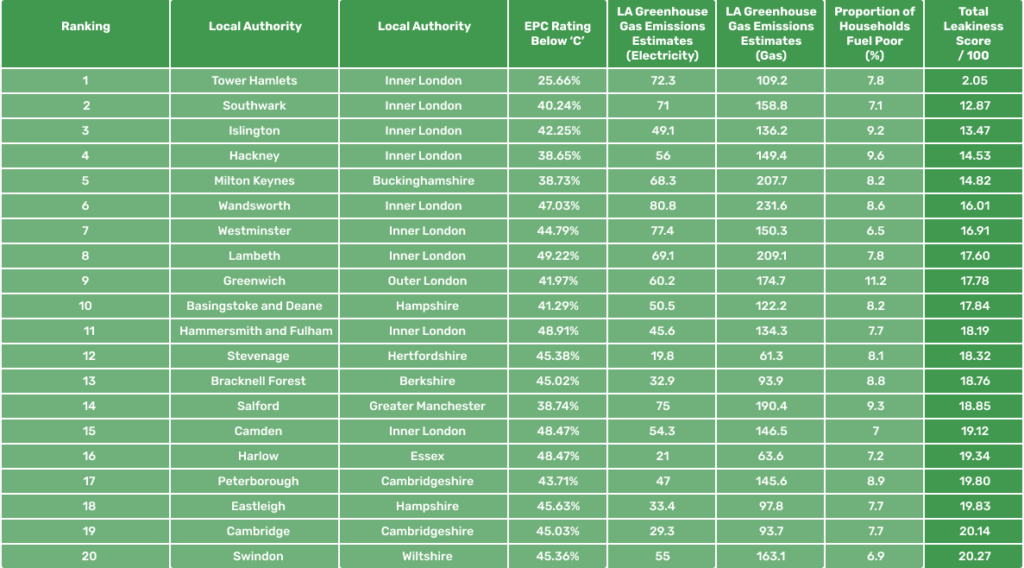
In the green zone, Tower Hamlets stands out as the clear frontrunner for energy efficiency, with a sizeable gap separating it from the second-placed area.
Not only does the area have a significantly low number of homes having an EPC rating below ‘C’, at 25.66%, compared to the majority of local authorities, but Tower Hamlets also had a considerably lower proportion of households in fuel poverty at 7.8%.
In fact, local authorities in Inner London make up seven out of the top 10 most efficient areas, pointing to Inner London as a clear standout where modern homes are far more energy efficient, and therefore in much less immediate need of support.
Also making the top 10 were Milton Keynes in Buckinghamshire and Basingstoke and Deane in Hampshire. Milton Keynes has kick-started its efforts in energy efficiency, with the city council’s Sustainability Strategy aiming for the area to be carbon neutral by 2030, helping to reduce local residents’ energy bills.
While schemes such as Warm Homes represent a major step forward, their long-term success will ultimately depend on the quality of the insulation upgrades being delivered.
For households living in older or poorly performing properties, inadequate insulation remains one of the biggest drivers of heat loss, high energy bills and uncomfortable living conditions.
Without the proper insulation, homes will continue to leak heat regardless of how efficient new heating systems become, as it’s the foundation of energy efficiency for any home.
While reviewing this research our CEO, William Bown, had the following thoughts to share:
“While the government’s Warm Home Scheme is a step in the right direction, our research proves that a universal approach won’t be enough to effectively support the British pubic.
“When the majority of the areas in the UK have an average EPC rating lower than C, it shows a significant structural gap that risks leaving millions of households exposed to persistently high energy bills and reinforces the need for more targeted, regional strategies. Ultimately, nobody wants to be paying such a high price just to afford the necessities in their home!
“That’s why we must have a fabric-first approach that ties in to this. The need for proper insulation is essential in helping schemes like Warm Homes have any real effect; otherwise, households will be missing out on real value in improving the amount of energy their homes waste.
“With energy affordability still a pressing concern for many households, the pace and targeting of intervention will be critical. If there’s a lack of intervention, it is households that will ultimately bear the brunt with higher monthly bills.
“For the UK to make real progress on its sustainability goals and help families manage rising energy bills, this funding needs to be backed by targeted, county-level strategies that reflect the different needs of homes across the country.”
To determine which areas of the UK will benefit the most from the Warm Homes Scheme, we looked at a number of key indicators to create an index score:
These factors were given a weighted score out of 100, which gives us our final index result.